The headline at the NPR site says it all: “Idaho Universities Must Decide Which Programs Matter Most.” Not surprisingly, then, at this year’s welcome address, Boise State President Bob Kustra emphasized the role of analytics in the process of program prioritization. My college’s dean also emphasized metrics and analytics in the college-wide meeting that week.
My head began to hurt. I’m a humanist. I’m not terribly comfortable with numbers, and I don’t like it when things that should be evaluated qualitatively are transformed into numbers.
Still, I felt I needed to educate myself about university metrics, and particularly about my university’s metrics. I went digging. I found, once again, that numbers are slippery, particularly when we’re talking about “costs” (what counts toward the cost? what doesn’t?), and not at all easy to interpret. Despite these liabilities, numbers are persuasive, and they can be marshaled to tell stories, factual or not, true or not. Often they are, to borrow a word from Stephen Colbert, truthy, in that they “cherry pick” numbers that seem to back up our gut feelings.
I know many of my fellow public university faculty are, like me, in an allegedly data-driven boat navigating the waters of a (real or fabricated) budget crisis. I’ve also discovered, locally and elsewhere, that despite a plethora of internal and external sources that provide university data, many faculty and even administrators remain unaware of the actual metrics of their universities; they’re believing spin and myth rather than looking at the data themselves.
I thought, then, I would highlight a few of the places where faculty, staff, students, and other stakeholders can find university metrics. Chances are your university has a data warehouse for employees, but even if you don’t have access to it, there are plenty of external places to find data.
As a model, I’ll share some metrics and findings from my own university that I think are important, but that may get overlooked in our discussions during program prioritization. I’m sharing these numbers because they emerge from a familiar context for me. While some of them may seem damning, I’m not highlighting them to reveal corruption or the failure of any one individual, office, or program.
That said, taken collectively, as you will see, these data can tell a story about priorities—if you’re open to hearing that kind of narrative.
I encourage you to follow along with my steps and discover some information about the colleges or universities of which you are an employee, student, parent or spouse of a student, donor, or community member.
But first, three caveats:
1. I’m a humanist, not a social scientist or mathematician, so I won’t be doing any fancy statistical analysis—rather, we’ll be relying on some basic arithmetic.
2. I know all institutions and organizations “cherry pick” data to tell a particular story, and I suspect that some universities go through the program prioritization process with an end goal in mind. They collect only the data that matter to the story they want to tell, manipulate the data, and interpret it in ways that confirm their top administrators’ perspective. I, of course, have my biases and priorities, too.
3. In every case here, I’m working with the latest reported data rather than the raw data or queries from an internal data warehouse. Some numbers may be slightly out of date, and of course a university’s self-reported data, as one reader reminds me, must be taken with a grain of salt, but I’m unaware of any major shifts locally in the numbers I’m discussing, though I have heard rumors our six-year graduation rate is on the rise.
Undergraduate education
Governing bodies in higher ed, as well as state funding agencies, are, of course, all about graduation rates, retention rates, and career outcomes. The last of these is perhaps hardest to capture, though student loan default rates can give us a glimpse of success or failure in the workforce. Fortunately, the first two are relatively easy to track, especially if you adhere to a relatively narrow definition of “graduation rate.” Let’s take a look at them.
Graduation rates
One goldmine of student information is the IPEDS Data Center, which anyone can access at the National Center for Education Statistics website. IPEDS allows you to examine individual institutions’ metrics, as well as compare institutions. If you poke around the site for a while, you’ll also find some interesting projections, like this one estimating the numbers of U.S. high school graduates, by race/ethnicity, through 2021, and some useful tables and figures, including this list of tables about financial aid. If you’re more stats-savvy than I am, you can download data sets and play with them in the software of your choice. (Prospective students looking for the right college “fit” should access the data via the NCES College Navigator.)
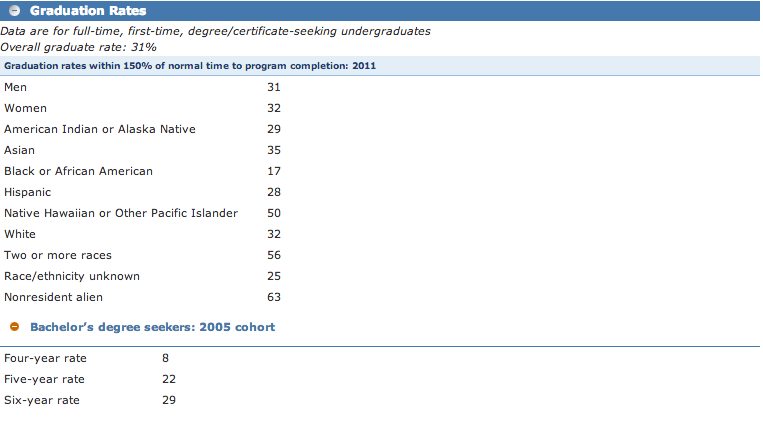
I’m always surprised that more faculty at my institution are unaware of Boise State’s four-year graduation rate. Here’s Boise State’s graduation rate data from IPEDS:
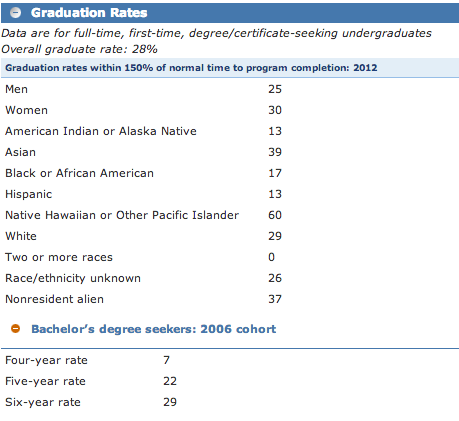
That’s a screen capture I took when I first conceived of this post a few months ago. Sadly, the most recent data available shows a 3% decline in the overall graduation rate, and a decline in the 4-year graduation rate:
Blink as much as you must—your eyes don’t deceive you. Boise State’s most recently-reported four-year graduation rate is 7 percent. Now, administrators everywhere will tell you that graduation rates are calculated unfairly, in particular because transfer students aren’t included—only “full-time, first-time, degree/certificate-seeking undergraduates.” That’s a fair criticism. However, it’s not fair to ignore entirely the 7 percent figure, as it indicates that for every 100 first-time, degree-seeking undergraduates that begin their college careers at Boise State, 93 won’t graduate from that university in four years–and 71 won’t graduate within six. That’s deeply troubling. (The national 6-year graduation rate is 59 percent, and 57 percent at public institutions—considerably higher than Boise State’s 29 percent.)
Funding undergraduate education
Let’s move on to funding for undergraduate education. I’ve observed some of Boise State’s administrators like to use the term “lean” rather than “underfunded” to describe the university’s programs. “Lean” not only suggests an efficient use of muscle/resources, but it also evokes the “lean start-up” paradigm so beloved by many business schools at the moment. I’m using “underfunded” instead of “lean” because I want to emphasize not how programs are performing with few resources, but rather make clear how little the state and university are investing in our students.
Unfortunately, the only current Boise State budget I was able to find is broken down by major categories; we can’t learn much from it. (Worse, it collapses student loans into the category “Scholarships & Fellowships.” Gah!) Fortunately, we aren’t constrained by the university’s lack of budgetary transparency online. (Update: a friendly Boise State librarian tells me paper copies of the budget can be checked out for two hours at a time, so check to see if your university’s library keeps a copy of the budget available.)
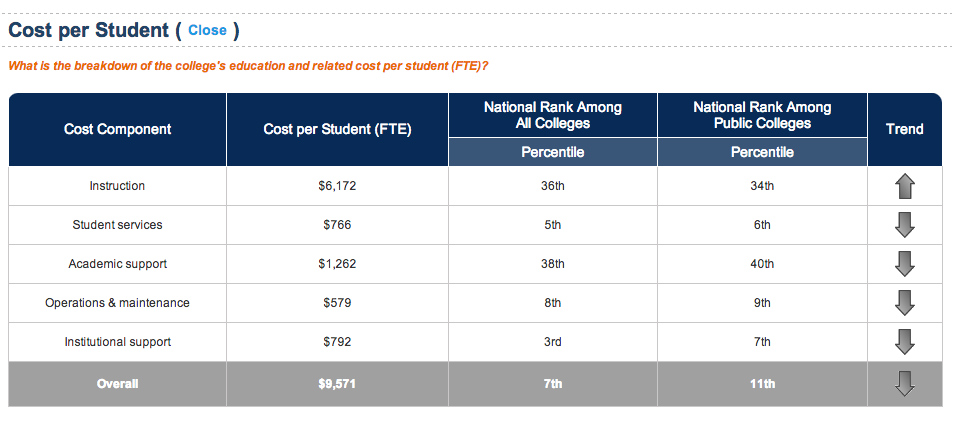
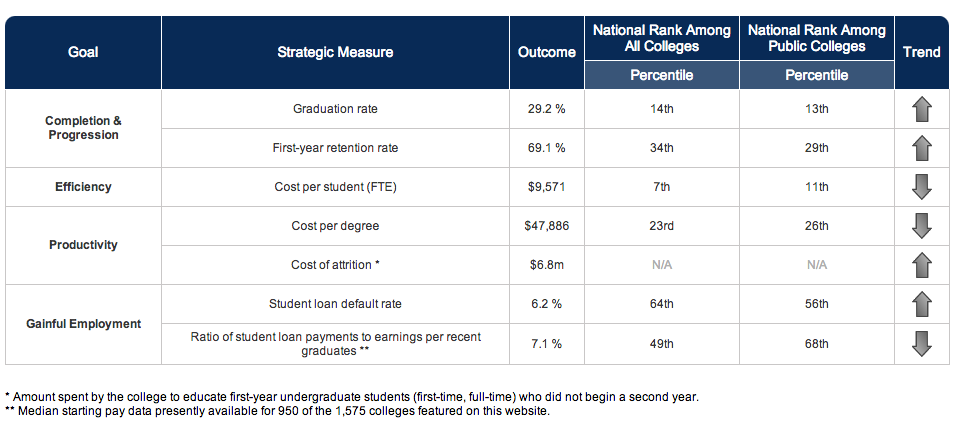
Thanks to the site College Measures, we can discover, to the dollar, how much the university declares it spends educating each undergraduate student per year: $9,571, which puts it in the 7th percentile overall among all colleges and the 11th percentile among public institutions. I’m glad to see the university ranks in the 36th percentile in instructional spending per student among all colleges, and 38th in academic support—not great numbers, but far better than its overall ranking.
A year’s in-state fees (charged in lieu of tuition) cost each undergraduate $6,292. (A brochure released yesterday by the university includes an asterisk that explains students are also charged $2,088 in “health insurance fees” (see page 10), but we won’t include those in our analysis.)
Here’s where I’ll refer you to a post about colleges’ discount rates I wrote on my admissions blog. To sum up: the discount rate is typically calculated as the difference between the full-fare cost of enrollment and what the average student and his or her family actually pay. The New York Times recently reported that small colleges are trying to get out of the discounting game, but I don’t think any institution will ever escape it, as there will always be a difference between what the student pays and the true cost of educating a student. I call this the “actual discount rate.” So, as I explain in my post at the admissions blog:
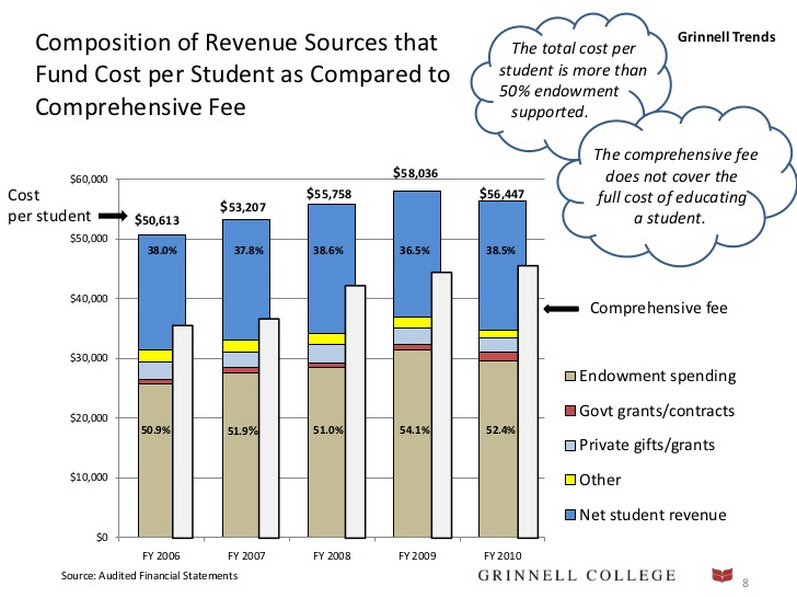
Just how generous is the actual tuition discounting at some colleges? Here’s a slide from a 2011 presentation Grinnell College made to its alumni and other stakeholders:
click to enlarge image
The chart reveals the college’s actual per-student costs varied from $50,600 to more than $58,000 per year, while the comprehensive fee hovered under $40,000. Even if all students paid the full fee, Grinnell was eating up to $20,000 per year per student! Even more astonishing, very few students pay the full fare at Grinnell, so the college was “losing” even more revenue per student. If you look at the blue portion of the bars, you’ll discover that revenue from students and their families covered on average only 36.5 to 38.5 percent of the college’s total cost. (Currently, about 85 percent of Grinnell’s students receive financial aid.)
Of course, $40,000 a year is still a lot of money for most families, but if you click through to that post, you’ll discover that the typical Grinnell student is expected to contribute $7,500 out of her own pocket and racks up only $12,350 in loans, meaning that, not counting student loan interest, she gets a college education worth at least $224,000 for less than $20,000. And that amount includes not only tuition and fees, but also room and board.
Now, you may think it unfair to compare an elite liberal arts college’s real discount rate with a practically open-admissions regional public university, but I’m going to do so anyway, as I’ve made the comparison for some of my students, and they find it enlightening. (They also often regret their choice of institution because they find themselves with a lot of debt.) If an in-state traditional student is one of the lucky ones who graduates from Boise State within six years, and she lives in the cheapest on-campus residence for two of those and uses her parents’ health insurance, according to Boise State’s own cost attendance calculator, her tuition, fees, room and board would look like this (if costs remain stable, which of course they won’t):
- First year, living on campus: $6,292 tuition/fees + $6064 room and board = $12,356
- Second year, living on campus: $6,292 tuition/fees + 5000 room and board = $11,292
- Third year, living off campus: $6,292 tuition/fees + $7,616 room and board = $13,908
- Fourth year, living off campus: $6,292 tuition/fees + $7,616 room and board = $13,908
- Fifth year, living off campus: $6,292 tuition/fees + $7,616 room and board = $13,908
- Sixth year, living off campus: $6,292 tuition/fees + $7,616 room and board = $13,908
The total the student pays, then, is $79,280 for an education that costs the state $57,426. That means Boise State students don’t actually get a discount rate if we count off-campus room and board. We’ll no longer be comparing apples to apples, as Grinnell students tend to live on campus for four years, but let’s subtract the off-campus room and board from that figure because the university isn’t seeing any of that money. Even then, the total the student pays to the university is $48,816, though the student of course still has to pay to live somewhere. If we remove this amount, then the student does indeed get a discount—$48,816 for a $57,426 education. (Of course, this is a hypothetical ideal; I’ve met Boise State graduates with $100,000 in student loan debt.)
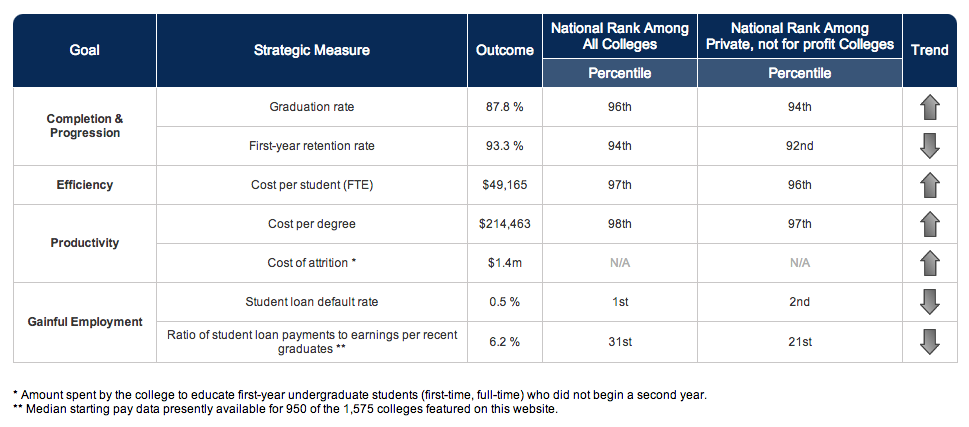
Of course, I’m using a mishmash of Boise State’s and Grinnell’s own data, along with data from College Measures, in these examples. Let’s compare the cost of an undergraduate education at each institution using only College Measures data.
Here’s Grinnell’s:
Click either image to enlarge it.
But wait–here the Boise State cost-per-degree is lower than I’ve estimated it to be–but that’s because the College Measures site assumes a five-year graduation rate, but as we’ve learned, the typical student, if she’s lucky, will graduate from Boise State in six years, whereas almost all Grinnell students graduate in four. Yes, Grinnell’s students are significantly different from Boise State’s students, but the question remains: what would happen if the university invested more per year in each student; would the four-year graduation rate increase? Would the six-year? What about the attrition rate, and, post-graduation, the student loan default rate? It’s worth investigating.
And what of retention, attrition, and the cost to the university of losing students? Thanks also to College Measures, we discover that in 2011, 31 percent of first-time, full-time undergraduates did not return to the university for their sophomore year. The university spent $6.8 million educating students it did not retain.
Again, I want to emphasize that I know it’s not entirely fair to compare an elite private college with a regional public university; doing so, however, allows us to see the kind of choices universities make, or are forced to make, based on their funding models. Everyone, including state legislators who set higher ed budgets, should be aware of the repercussions of these choices. And remember, once we have a sense the spectrum of choices, we can perhaps better begin to understand the choices being made at “peer institutions”—and we’ll look at those in the next section.
Faculty compensation
Maybe improving faculty morale might help retain faculty and therefore students? Many of my teaching readers have undoubtedly had the experience where a student (for me it’s usually a graduate student) admits she is returning the following year just because you’re there to support her. Few faculty are truly irreplaceable, but often students view individual faculty as essential to their success.
Of course, one great way to improve faculty morale (or at least retain some faculty) is to pay faculty fairly. We know about the adjunct crisis, and it needs to be addressed in a huge way, and quickly. (Although, oddly, Boise State’s pay rate for full-time, non-tenure-line instructors is above average, though I suspect there may be a few fantastically paid outliers who are messing up that particular curve. The state salary database shows that one of our local celebrities, for example, gets paid $150,000 per year despite the title “adjunct faculty” and a highest degree of B.A.) The size of the adjunct issue—76 percent of faculty nationwide are now contingent—can easily obscure the fact that tenure-line faculty income has been stagnating.
In a previous post, I compared my own salary, as well as my take-home pay, to the cost of living in Boise. You can use the Economic Policy Institute’s Family Budget Calculator to determine the cost of living in your city or town.
This year, our dean announced the college would make one-time salary adjustments, so that full profs would earn 84.5 percent of the median CUPA salaries for their rank—so, they’re still 15.5% below median, but, hey, it’s an improvement. Still, faculty in our History department make far less than those in, say, the business school.
If you’re not sure what your colleagues make, you can ask them if you’re comfortable doing so (yes, I know most people aren’t, and in higher ed we need to get over this etiquette roadblock for the sake of solidarity), or, if you’re at a public institution, chances are the salaries are already available online; simply search for the name of your state plus “state employee salaries.” Sometimes this information is made available by the state itself; other times, newspapers have made it available. Idaho’s state salary database, for example, is hosted by the Idaho Statesman, and California’s can be found at the Sacramento Bee. You can, of course, look up the average salaries for your discipline at the CUPA site.
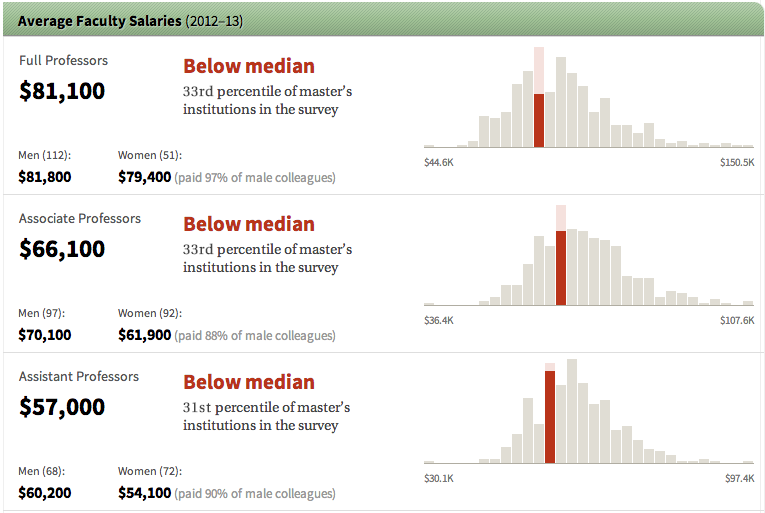
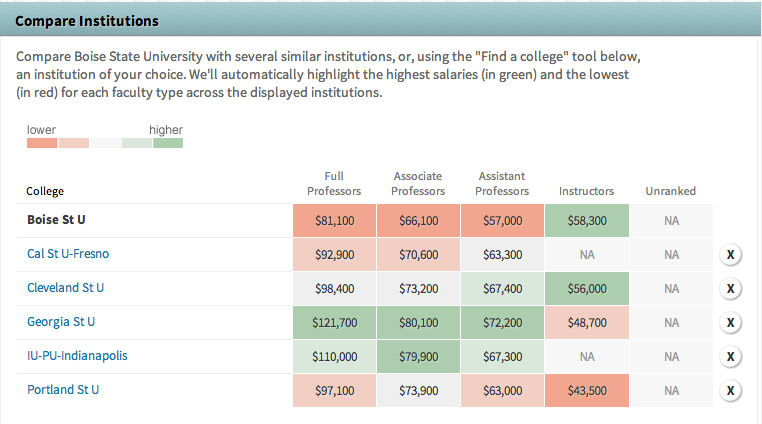
To find out the average faculty salaries from your institution, use the Chronicle’s faculty salary tool. Here’s where Boise State stands:
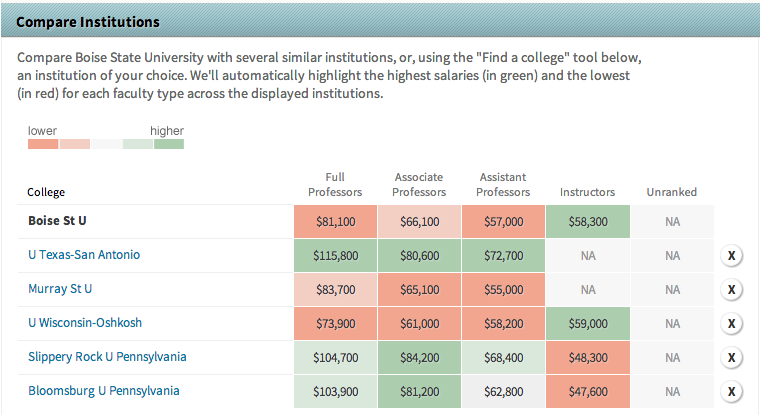
The Chronicle tool also allows you to compare data across institutions. It autofills the comparison fields with “several similar institutions.”
I suggest you take a look at that data, but then also look at your college’s peer institutions. Some colleges post this information on their own websites—here’s Boise State’s list—but if that’s not the case for your institution, you can find the colleges and universities your institution considers its peer using this slick peer institution tool at the Chronicle. (It also lets you see which schools believe your institution to be their peer; in Boise State’s case, that list includes a variety of public universities around the U.S., as well as one DeVry and three University of Phoenix campuses.)
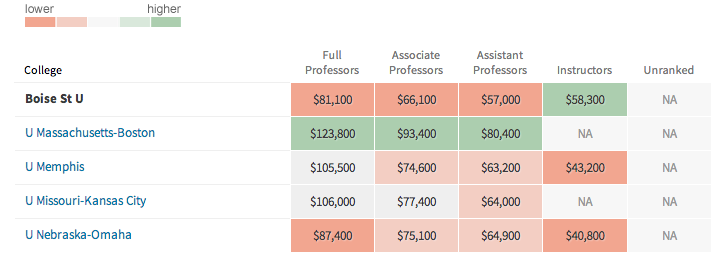
And here are Boise State’s “aspirational” peers:
The tl;dr version of those tables: Boise State pays its faculty less—in some cases significantly less—than its peer institutions, regardless of whether they’re current or aspirational peers. Yesterday the governor’s state-of-the-state address for 2014 made clear there won’t be any pay raises for state employees this year, unless someone is being promoted. In my time at Boise State—this is my fourth year—faculty have received one raise of 2 percent. If this pattern persists, I know many of us will be unable to afford to keep our jobs, as cost of living has already outpaced our salaries. Perhaps you have observed this to be the case at your institution as well.
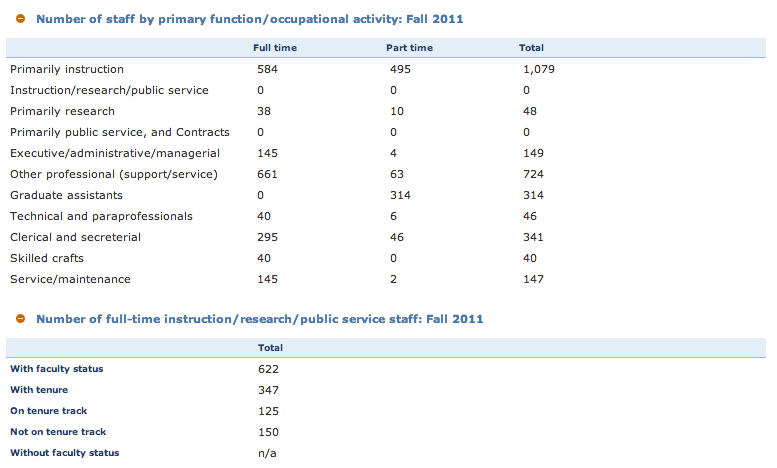
As the Chronicle explains below the tables, these figures represent only “full-time staff whose primary role is instruction, regardless of whether they have formal ‘faculty status.’ That includes tenured, tenure-track and non-tenure-track faculty. Left out are any part-time instructional staff, which can include adjunct faculty.”
To see, then, how many teaching faculty are made invisible by this survey, return to the IPEDS Data Center, find your institution, and then click on “Financial and Human Resources.” Finally, click on the + next to the items “Number of staff by primary function” and “number of full-time instruction/research/public service staff.” Here’s Boise State’s information:
Even more information from IPEDS
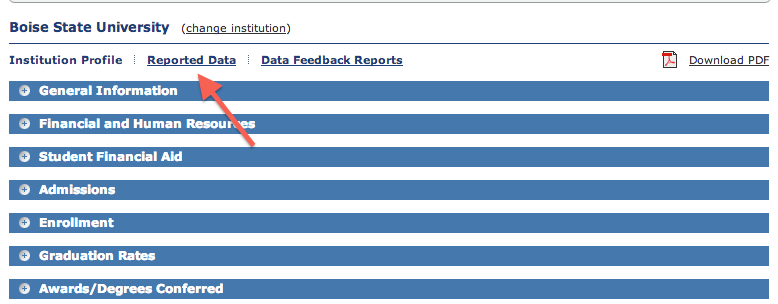
Note that you can also look at data from previous years by searching for your institution, then clicking on “Reported Data”:
There’s a lot of relatively fine-grained information in that archived data about various aspects of the university. I find the student financial aid info particularly interesting. You can also download any of this reported data as a PDF. For example, here is the PDF I downloaded about 2011-12 financial aid at Boise State. It’s not the easiest thing to decipher, especially because the formatting of the reported data has changed over the years, but if you’re an inquisitive or investigative type, you’ll probably find it’s worth poring over.
Administration and athletics
It’s common for columnists and other armchair accountants outside of higher ed to blame faculty salaries for the quickly rising costs of a college education. Chances are very good that the data you’ve found about your college or university shows faculty salaries aren’t driving increasing costs.
If we aren’t investing a ton of money into student and faculty retention, then where are we spending it? All over, really. But two places where costs have been rising in the past decade or two are athletics and administration. In fact, according to a brochure released this week, Boise State employs 260 more full-time “professional staff” than it does full-time faculty. (That speaks volumes about faculty, or even shared, governance, doesn’t it?) The “professional staff” category, which typically includes salaried, non-academic staff exempt from overtime laws, does not include classified staff; there are an additional 529 full-time classified employees at Boise State.
The university pays its vice presidents between $206,000 and $220,000 per year, and its president roughly $400,000. For comparison, that’s in line with recent salaries for chancellors at the University of California—campuses I’m guessing most faculty would consider far more successful as research and teaching institutions. Some people might point out that university presidents make far less than CEOs of comparably-sized private-sector companies, so the salary is reasonable. I might point out that faculty—yea, even in the arts and humanities—also make less than they would as employees in the private sector.
But what of athletics? What kind of money is your institution spending there? Here you might have to do some digging in your local newspaper’s online archives.
The football coach who left Boise State at the end of this season made $1,898,000 per year and licensed his likeness to the university for a quarter million dollars per year.
Some of you will say I’m comparing apples to oranges with the next comparison, but it’s important to look at these two numbers together, as once again, the difference in the numbers throws institutional priorities into high relief.
The football coach made more than $2 million per year, plus myriad benefits. Discussion leaders for courses in the university’s new general ed/core Foundations program are paid only $1,000 per semester.
But let’s look beyond employees. What does the university say it spends on student athletes?
In 2010, Boise State spent $13,018 in operating expenses per football player. This is lower than the NCAA Division I average, but it’s also just slightly less than half of my take-home salary each year. It’s also $3,500 higher than the university spends educating an undergraduate for a year. The university spends 27 percent more on outfitting and training its football players than it does supporting students’ education.
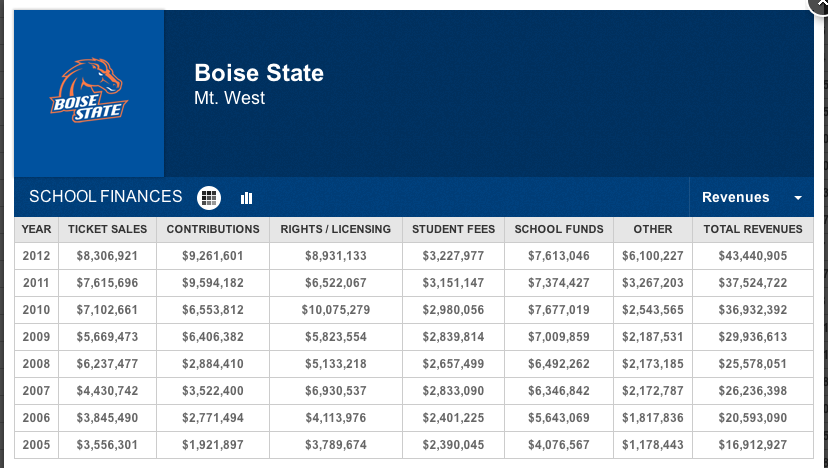
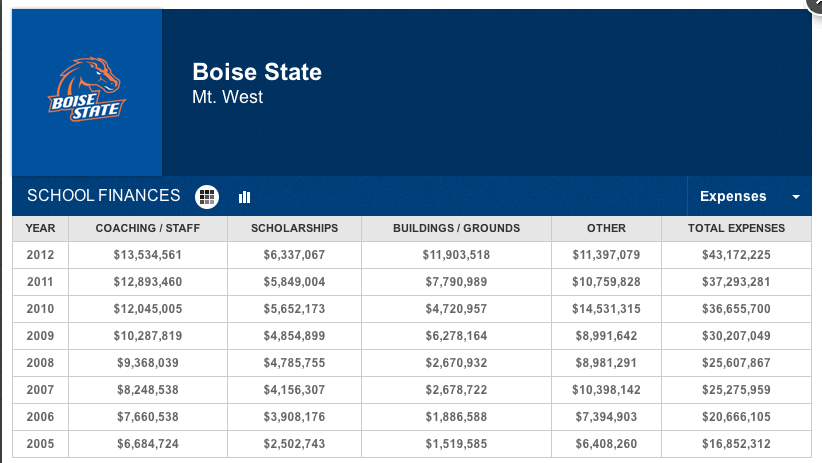
You can find a thumbnail of major college athletic teams’ financial information at USA Today. Here’s what the site shares about Boise State; I encourage you to see if your institution is on this list and take a hard look at its figures as well.
Revenues:
Expenses:
Be sure to check out the report authors’ methodology and category definitions. Pay particular attention to the definition of “subsidy”—”the sum of students fees, direct and indirect institutional support and state money”—as in the main list of universities, you can see that Boise State athletics are subsidized by this kind of support—again, these are state appropriations and student fees—at 24.96 percent.
According to the Idaho Statesman, the Boise State athletics budget for this past year was $33.4 million, which represents a $1 million shortfall from its projected revenues. According to NCAA figures, the university actually spent $43,172,225 on athletics, with $43,440,905 in revenue–nearly $11 million of which was subsidized by the state or student fees. Despite what is suggested by the “total revenue” vs. “total expenses” numbers in the charts above, athletics are a long, long way from paying for themselves because they are subsidized.
. . .which is funny, because we’re always hearing about how important it is for academic programs to be self-supporting.
(And even if they once were on a trajectory to increase revenue, football ticket sales are declining.)
Reflection
One of the liabilities of having researchers and teachers as employees is that we undertake research, investigating the subjects and following the leads that most interest us, and then share our findings with students and the public. That’s what I’ve done in this post. And yes, I’m cherry-picking from the available data in choosing what to share here, but it’s the data that concerns what matters most to me: the undergraduate educational experience and its outcomes.
I’m sure some university officials are going to contest the data I have shared, suggesting I’ve crunched it wrong or used out-of-date information. Perhaps I have. Yet by highlighting this reported data, asking some questions, and encouraging my readers to mine the data themselves, I’m trying to start a broader and deeper conversation among faculty, students, staff, and other stakeholders.
State governments and universities talk a good deal about transparency, and this post is offered in that spirit.
That said, I try to include in all my teaching and public outreach a critical thinking activity, and this post will not be an exception.
Let’s think critically for a moment
To be honest, it’s very difficult for me to look at these figures and not editorialize extensively about campus and state priorities, and I worry more than a little bit that even highlighting the straight numbers for the public will make me unpopular on campus and elsewhere. I’m going to let you, therefore, construct various narratives around the data I’ve presented.
I can’t, however, finish this post without asking a few pointed, leading questions.
1. Why is a purportedly academic, intellectual institution investing so much money in a sport that does this to its players’ brains? Beyond brand awareness for admissions—the benefit faculty and administrators alike cite to me as the major benefit of the football program—what does the university get from placing students in danger of lifelong brain injury? And, as a faculty member, to what extent am I complicit in the destruction of these students’ futures?
Guess which brain belonged to a football player, aged only 42?
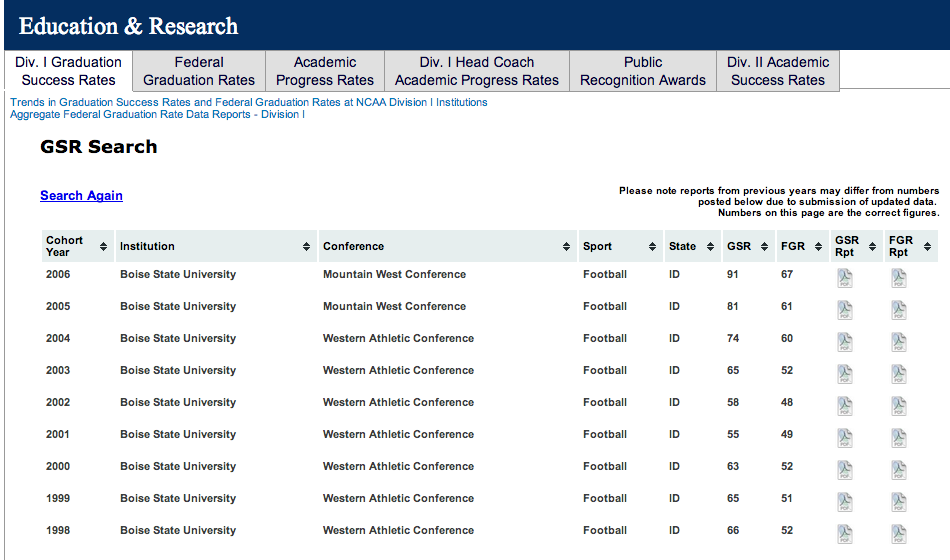
2. What if we invested into student and faculty retention the $11 million of state appropriations and student fees currently going to athletic subsidies, plus some of the inflated salaries of the ever-proliferating associate vice presidents? Our football players’ graduation rate over six years—67 or 91 percent, depending on how you calculate it (see info below from the NCAA graduation rate tool)—is far better than the overall university’s, so why not offer non-athletes the same kinds of academic support athletes receive?
3. Why is there only one tenure-line faculty member on the program prioritization committee that will be making important decisions about how the university invests its resources?
We often hear that universities should be run “like businesses,” and indeed, faculty have noted the business-speak (strategic dynamism!) and capitalist imperatives (disguised as an embrace of entrepreneurial thinking and institutional efficiency, e.g., MOOCs) that have seeped into the rhetoric and decision-making at the university in recent decades. I’d argue that universities have been trying for some time to become more like businesses—behavior driven not just by trends, but by declining state revenues—and they’re failing pretty miserably. Perhaps they’re not running the right cost-benefit scenarios or SWOT analyses, so I encourage you to undertake your own for those institutions that matter to you.
Still, let’s play along for a minute, and consider students as the university’s “customers” or its “products”:
4. How might we shift our investment of limited resources so that we can increase both retention and graduation rates for our student “customers”? Should we be investing in instruction, academic support, student life, academic technology, or upper administration to produce better “products” for our communities and economy?
5. How will these metrics be translated into analytics for the purposes of program prioritization, at Boise State or elsewhere? That process has not been as transparent as it might be here. (In case this is all mumbo-jumbo to you, as it was to me, here are metrics vs. analytics, explained.)
These questions have no easy answers, and probably not comfortable or comforting ones, either. The data itself is complicated, and determining cause-and-effect even more so.
Please use this information
My challenge to you: Using the resources to which I’ve linked here, as well as others available to you locally, go through the exercise of finding the data that matters to you, share it publicly, and, if you’re comfortable with it, offer your interpretation of it—or ask questions about how we might use it, as I’ve done. If you’re a faculty member, this kind of research, driven by you or by students, also might form the base of an activity or assignment in some undergraduate or graduate courses.
If readers are interested, I’d be happy to create and share a downloadable list of data sources and other resources for this kind of research. Let me know if you’d find that useful.




If you want to be taken seriously, you shouldn’t start any discussion with, “I’m bad at math.” It undermines everything that you say after. Seriously, I would cut those parts out of this post ASAP.
Sage advice, Nicoleandmaggie. Yet I’m going to leave it for now, as I don’t say I’m bad at math, just that I’m not a professional social scientist or mathematician, and that as a particular kind of humanist I’m uncomfortable with numbers. This post is me working through that, trying to be OK with looking at numbers, and maybe modeling that a bit for others who might find numbers also make them uncomfortable.
“I’m not comfortable with numbers” = “I’m bad at math.” That is what my students always mean when they say it. That’s what heads who run education non-profits into the ground say (N = 2). We even had a job candidate for a semi-administrative position say it during her talk one time– she did not get an offer. It’s standard code. It completely undermines anything that you are going to say. And you say similar things more than once before you even get into the meat of what you’re about to say. At which point, tl:dr.
If you want to make an impact with this lengthy post, greatly shorten that intro section and get rid of all the “I’m not any good at this stuff” (which if it’s said at all, it only needs to be said once) and get to the point earlier.
oh brother.
Impressive and potentially useful; thanks! (as a fellow humanist, I don’t mind the slightly rambling/reflective presentation, and the “numbers aren’t my forte” caveat, but I do take N&M’s point about appealing to more numerate — or metric-obsessed, whether or not they’re numerate; the two don’t seem to be in any way connected, and may even be inversely related in some cases — audiences).
The thing I wish I could figure out for my school is the degree to which introductory/gen ed classes (most often taught by lower-paid contingent faculty, and under continual pressure to become even more “efficient”) subsidize other university functions (a certain amount of subsidy of upper-level classes, and a certain amount of overhead that supports genuinely necessary support functions/staff, I don’t mind, but it still would be useful to know, and to be able to argue that a bit more of the money could be plowed back into better supporting and compensating the instructors in those classes, perhaps in lieu of paying for some fancy “retention” package, and the administrators to use it, assess its results, etc., etc.) I can more or less figure out tuition expenses and faculty salaries (thanks to a combination of publicly-available information for full-time faculty and adjunct salary information collected by the adjunct project), but it’s hard to figure out what proportion of those classes is taught by various classes of faculty: TT, full-time non-TT, part-time non-TT. I suspect that it’s broken down somewhere in documents submitted for accreditation, and that those documents are available somewhere, but I haven’t found them so far (but haven’t, admittedly, looked all that hard).